

The Deathbelt: Murder on the East Coast
The Causes of Murder Clusters on the East Coast

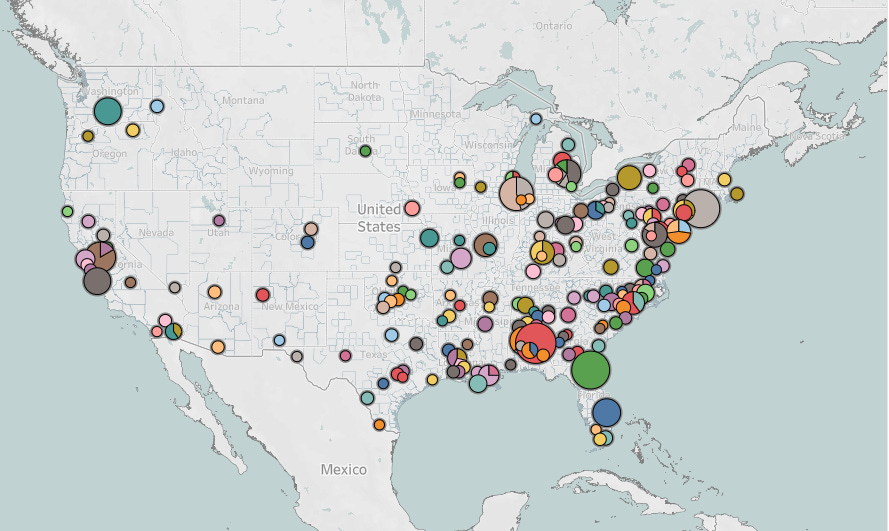
A striking interactive map spanning five decades of American homicide data reveals something that criminologists have long suspected but rarely seen visualized with such clarity: murder in the United States is not random. It clusters — geographically, demographically, and structurally — and the Southeast is its undeniable epicenter. From 1974 to 2024, that map tells a story the nation has been slow to confront.
A Nation Divided by Dots
The visualization produced by the Murder Accountability Project (MAP) — a nonprofit organization founded by former Washington Post journalist Thomas Hargrove — overlays fifty years of FBI Supplementary Homicide Report data onto a geographic canvas of the contiguous United States. The result is unmistakable: a dense, colorful constellation of homicide clusters that grows dramatically thick east of the Mississippi River, and denser still as the eye travels south.
The circles on the map are proportional to case volume. The colors, drawn from an extensive palette, distinguish individual law enforcement jurisdictions. What immediately strikes the trained observer — and the casual one alike — is the sheer mass of overlapping circles in a corridor stretching from the mid-Atlantic states down through Virginia, the Carolinas, Georgia, Alabama, Mississippi, Louisiana, and into Florida and Texas.
Compare this to the sparse, isolated markers that dot the Great Plains, the Mountain West, and the northern tier of the country. A circle here and there — Denver, Salt Lake City, Seattle — but nothing approaching the visual weight of the Southeast.
“The South has always been America’s most violent region. What this map makes plain is that this reality has not fundamentally changed across five decades.”
The Southeast stands out not merely because of raw population. Adjusting for population density, the region’s homicide rates have consistently outpaced the national average. According to the Centers for Disease Control and Prevention’s WISQARS database, the Southern United States has maintained the highest regional homicide rate in the country for every year of the dataset’s span. In 2022, the South accounted for approximately 55% of all U.S. homicides despite containing roughly 38% of the national population.
Sources: CDC WISQARS Fatal Injury Reports, 2022; U.S. Census Bureau Regional Population Estimates, 2022; FBI Uniform Crime Reports / NIBRS
The Southern Violence Thesis — A Century in the Making
The overrepresentation of Southern states in American homicide data is not a recent discovery. Scholars have debated its roots for well over a century. What the MAP visualization does is present the accumulated weight of that history in a single, visceral image.
Sociologist Ellsworth Faris first drew systematic attention to regional violence differentials in the early twentieth century. By mid-century, criminologist Marvin Wolfgang — whose foundational 1958 work Patterns in Criminal Homicide remains a cornerstone of the field — noted that Southern states consistently reported higher rates of lethal interpersonal violence than Northern counterparts, even after controlling for urbanization and poverty.
The most influential modern explanation is what scholars call the Culture of Honor hypothesis, most systematically articulated by social psychologists Richard Nisbett and Dov Cohen in their 1996 book Culture of Honor: The Psychology of Violence in the South. Their argument: the South was disproportionately settled by Scots-Irish herders from the borderlands of Britain — people whose livelihoods in a lawless frontier environment depended on personal reputation and the credible threat of violent retaliation. Unlike settled farmers who could rely on community enforcement mechanisms, herders had to signal that they would defend what was theirs. This produced a normative framework in which personal honor, male aggression, and violent response to perceived insult became culturally valorized across generations.
“In a culture of honor, an insult is not merely an affront — it is a status threat requiring forceful response. The data suggests this norm has proven remarkably durable.”
Nisbett and Cohen supported their thesis with experimental laboratory studies as well as historical data — demonstrating, for instance, that white male Southerners exhibited stronger physiological and behavioral responses to perceived insults than Northern counterparts. Subsequent research by Steven Pinker (The Better Angels of Our Nature, 2011) extended and largely validated this framework as part of a broader explanation for American regional violence differentials.
Sources: Nisbett & Cohen, Culture of Honor (1996); Wolfgang, Patterns in Criminal Homicide (1958); Pinker, The Better Angels of Our Nature (2011); Faris, American Journal of Sociology (1917)
Structural Inequality and the Legacy of Slavery
The culture of honor thesis, while compelling, is insufficient on its own. It cannot, for instance, adequately explain why homicide rates in the South are dramatically higher among Black Americans — a population not descended from Scots-Irish herders — than among white Southerners.
To explain the full picture, researchers have increasingly pointed to structural inequality rooted in the region’s particular history. The South’s plantation economy, built on enslaved labor, left behind a legacy of economic exclusion, legal disenfranchisement, and spatial segregation whose effects have proven extraordinarily persistent. Sociologist Robert Sampson’s extensive work on neighborhood disadvantage — most comprehensively summarized in his 2012 book Great American City — demonstrates that concentrated poverty, residential instability, and weak institutional social control are among the most powerful predictors of homicide at the community level.
The South contains a disproportionate share of America’s persistently poor counties. According to USDA Economic Research Service data, roughly 340 of the nation’s approximately 380 “persistently poor” counties — those where 20% or more of the population has lived in poverty for three consecutive census periods — are located in the South, concentrated in Appalachia, the Black Belt, and the Lower Mississippi Delta.
This overlap between persistent poverty geography and homicide cluster geography on the MAP visualization is not coincidental. It reflects a structural condition that policies of mass incarceration, inadequate public investment, and disinvestment in mental health and social services have done little to resolve.
Sources: Sampson, Great American City (2012); USDA Economic Research Service, Persistent Poverty Counties (2023); The Violence Policy Center, State by State Homicide Reports (2023)
Firearms Availability and Permissive Gun Laws
The Southeast is also ground zero for permissive firearms policy in the United States. A 2020 analysis published in Annals of Internal Medicine by researchers at Boston University School of Public Health found a statistically significant association between state-level gun law permissiveness and firearm homicide rates, after controlling for a range of demographic and socioeconomic factors. States with the most permissive gun laws — which disproportionately cluster in the South and Southeast — showed markedly higher rates of firearm homicide.
Mississippi, Louisiana, Alabama, and Arkansas have consistently ranked among the top five states for both gun law permissiveness (as measured by Giffords Law Center’s annual scorecard) and firearm homicide rates. Louisiana has led the nation in overall homicide rate in multiple years of the studied period. In 2022, its rate was approximately 22.6 per 100,000 residents — more than four times the national average of 5.5 per 100,000.
Gun prevalence in the region is not merely a policy artifact — it is deeply cultural. Survey data from Pew Research Center (2017) found that approximately 54% of rural Southerners personally owned firearms, compared to 25% of urban Northerners. In communities where honor norms prevail and state enforcement capacity is weak, the ready availability of lethal weapons has predictably lethal consequences.
Sources: Santaella-Tenorio et al., Annals of Internal Medicine (2020); Giffords Law Center Annual Gun Law Scorecard (2023); Pew Research Center, America’s Complex Relationship With Guns (2017); CDC WISQARS, State Firearm Homicide Rates (2022)
Urban Density and the Northeast-Southeast Continuum
While the Southeast dominates the raw homicide count on the MAP visualization, close inspection reveals a second dense corridor running along the Eastern Seaboard — from Greater New York and Philadelphia through Baltimore, Washington D.C., and Richmond into the Carolinas and Georgia. This corridor deserves separate analytical attention, as its drivers differ meaningfully from the rural Southern pattern.
The dense East Coast clusters are primarily products of mid-sized and large urban centers: Baltimore, Maryland — whose homicide rate has ranged between 40 and 60 per 100,000 in recent years, making it one of the most murderous large cities in the developed world — along with Philadelphia, Washington D.C., Atlanta, and Charlotte. These cities share several criminogenic features that differ from the rural Southern pattern.
First, they are characterized by extreme spatial inequality — affluent neighborhoods in close proximity to areas of concentrated poverty. Research by economist Patrick Sharkey (Stuck in Place: Urban Neighborhoods and the End of Progress toward Racial Equality, 2013) documents how Black urban communities in these cities have faced decades of disinvestment, police underinvestment in solving crimes (particularly non-fatal shootings), and the entrenchment of illicit drug economies as substitute economic institutions.
“Baltimore has more unsolved murders per capita than almost any city in the developed world. The clearance rate crisis isn’t a side note — it is the story.”
Second, the East Coast corridor has been the primary geography of America’s illicit drug economy since the crack cocaine epidemic of the 1980s. The heroin and fentanyl crises of the 2010s have layered additional lethal conflict onto existing drug market infrastructure. Economist Steven Levitt’s influential analysis in the Journal of Economic Perspectives (2004) estimated that drug market-related homicides accounted for a substantial fraction of the homicide surge of the late 1980s and early 1990s, a conclusion largely supported by subsequent research.
Third, and critically: the East Coast urban corridor suffers from a homicide clearance rate crisis. Data compiled by the Murder Accountability Project itself — one of the project’s central research contributions — shows that clearance rates for homicide in cities like Baltimore, Philadelphia, and Atlanta have fallen dramatically since the 1960s, when roughly 90% of homicides were solved. By the 2010s and 2020s, many of these cities were clearing fewer than 50% of homicides, and in Baltimore the rate fell below 30% in some years.
This matters enormously for the cluster patterns visible on the MAP visualization. Criminological theory since Gary Becker’s foundational economic model of crime (1968) has recognized that deterrence depends on the perceived probability of punishment. When homicide clearance rates approach the coin-flip level, the deterrent effect of murder prosecution is severely attenuated. Thomas Hargrove and the Murder Accountability Project have argued — with substantial empirical support — that the clearance rate collapse is itself a driver of continued homicide, creating communities in which killers reliably escape accountability.
Sources: Sharkey, Stuck in Place (2013); Levitt, Journal of Economic Perspectives (2004); Murder Accountability Project Clearance Rate Database (2024); Becker, Journal of Political Economy (1968); Baltimore Sun Homicide Database, 2024
The Serial Killer Problem: What MAP Was Built to Find
The Murder Accountability Project’s visualization tool was not originally designed merely as a regional homicide heat map. Its deeper purpose — and one of the most significant contributions of the dataset — is to identify potential serial killer activity through analysis of victim demographic patterns in unsolved cases.
Hargrove developed the project partly in response to the FBI’s Project HITS findings and subsequent research suggesting that serial killers are substantially undercounted in official statistics, and that a disproportionate number operate by targeting vulnerable populations — particularly sex workers and homeless individuals — whose murders are less likely to trigger intensive investigation.
A landmark 2017 analysis by Hargrove and colleagues, drawing on the MAP database, identified statistically anomalous clusters of unsolved murders of women — often showing similar victim profiles and geographic proximity — in areas across the South and East Coast. These clusters, the researchers argued, were consistent with patterns one would expect from unidentified serial perpetrators. The FBI subsequently acknowledged, in congressional testimony in 2018, that the number of active serial killers in the United States at any given time was likely in the dozens to hundreds, far exceeding public perception.
The southeastern United States has produced a disproportionate share of America’s confirmed and suspected serial killers. Between 1980 and 2020, states including Florida, Texas, Georgia, and California account for the largest numbers of confirmed serial homicide cases in the Radford University/FGCU Serial Killer Information Center database — though the Southeast states punch well above their population weight when normalized by per-capita measures.
Sources: Murder Accountability Project, Unsolved Homicide Cluster Analysis (2017); FBI Congressional Testimony on Serial Homicide (2018); Radford University/FGCU Serial Killer Information Center Database (2020 edition); Hargrove, Washington Post investigative reporting archive
The Accountability Gap
The MAP visualization, taken in full, is not merely a record of tragedy. It is an accountability document. Each circle represents not just homicides committed, but cases that required official response — and in too many instances, received inadequate response.
The Murder Accountability Project’s core finding is that America is failing to solve murders at an accelerating rate. In 1965, U.S. law enforcement cleared approximately 91% of homicide cases. By 2020, that figure had fallen to approximately 50% — meaning that for the first time in recorded American history, a murder in the United States was more likely to go unsolved than solved. In the South and in large Eastern cities, these figures are worse still.
This is not merely a statistic. Behind each unsolved case is a family denied closure, a community denied justice, and — with near certainty — a perpetrator who remains free to kill again. The Harvard Kennedy School’s Program in Criminal Justice Policy and Management has estimated that improving homicide clearance rates to their 1980s levels would prevent thousands of additional homicides annually, through both incapacitation and deterrence effects.
The southeastern clusters visible on the MAP visualization are, in significant measure, a monument to this failure. They represent not only the baseline violence produced by structural inequality, cultural norms, and firearms availability — they represent the compounding effect of impunity.
“Every unsolved murder is, in effect, a license to kill again. The map shows us where those licenses have been issued most freely.”
A Call to Action
For readers of TheColdCases.com, these findings carry both professional and personal weight. Cold cases are not aberrations from a functional system — they are, in many regions of the country, the expected outcome of a system operating exactly as it has been resourced and structured to operate.
Addressing the pattern requires confronting its multiple causes simultaneously: the structural poverty and segregation that concentrate violence in specific communities; the firearms policies that transform interpersonal conflicts into lethal ones; the cultural norms that valorize violence as a response to disrespect; the resource constraints and institutional failures that depress clearance rates; and the political will that has too often been absent.
The MAP visualization is a tool. Its value lies not in the aesthetic power of its colored circles but in what those circles can compel — more resources for cold case investigations, better data-sharing between jurisdictions, more systematic analysis of victim patterns that might indicate serial offending, and a long-overdue national reckoning with the geography of American violence.
The dots on that map are not abstract. They are people. They are the 400,000-plus homicides recorded in the United States between 1974 and 2024. A significant portion of their killers remain unidentified, unapprehended, and free. The first step toward changing that is looking honestly at where, and why, the dots are so dense.
SOURCES AND FURTHER READING
Primary Data Sources
• Murder Accountability Project / murderdata.org — Homicide data visualization and clearance rate analysis, 1965–2024
• FBI Uniform Crime Reports / NIBRS (National Incident-Based Reporting System), 1974–2023
• CDC WISQARS (Web-based Injury Statistics Query and Reporting System) — Fatal injury data by state, 2000–2022
• U.S. Census Bureau — Regional population estimates and poverty data
• USDA Economic Research Service — Persistent Poverty County classifications, 2023
• Baltimore Sun Homicide Database — homicides.news.baltimoresun.com
Academic and Research Sources
• Nisbett, R.E. & Cohen, D. (1996). Culture of Honor: The Psychology of Violence in the South. Westview Press.
• Wolfgang, M.E. (1958). Patterns in Criminal Homicide. University of Pennsylvania Press.
• Pinker, S. (2011). The Better Angels of Our Nature: Why Violence Has Declined. Viking.
• Sampson, R.J. (2012). Great American City: Chicago and the Enduring Neighborhood Effect. University of Chicago Press.
• Sharkey, P. (2013). Stuck in Place: Urban Neighborhoods and the End of Progress toward Racial Equality. University of Chicago Press.
• Levitt, S.D. (2004). Understanding Why Crime Fell in the 1990s. Journal of Economic Perspectives, 18(1), 163–190.
• Santaella-Tenorio, J. et al. (2020). Firearm Homicide Rates and State Gun Laws. Annals of Internal Medicine.
• Becker, G.S. (1968). Crime and Punishment: An Economic Approach. Journal of Political Economy, 76(2), 169–217.
• Radford University / FGCU Serial Killer Information Center Database — Aamodt, M.G. (Ed.), 2020 edition.
Journalism and Policy Reports
• Hargrove, T. — Murder Accountability Project investigative reporting and congressional testimony archive
• FBI Congressional Testimony on Serial Homicide, Senate Judiciary Committee, 2018
• Giffords Law Center to Prevent Gun Violence — Annual Gun Law Scorecard, 2023
• Violence Policy Center — State by State Homicide Reports, 2023
• Pew Research Center — America’s Complex Relationship With Guns (2017)
• Harvard Kennedy School Program in Criminal Justice Policy and Management — Homicide clearance rate studies
I would add another factor for violence in the Southeast and South.
The cultivated sense of "honor brought low" in generations of Confederate descendants. The belief that they were the victims of a great injustice. It makes every slight intolerable.
The Bible Belt is a dangerous place